14 Noise
14.1 What is noise?
Much human decision-making can be characterised as inconsistent. There is “noise” in the decisions. When presented with the same information on different occasions, people often draw different conclusions.
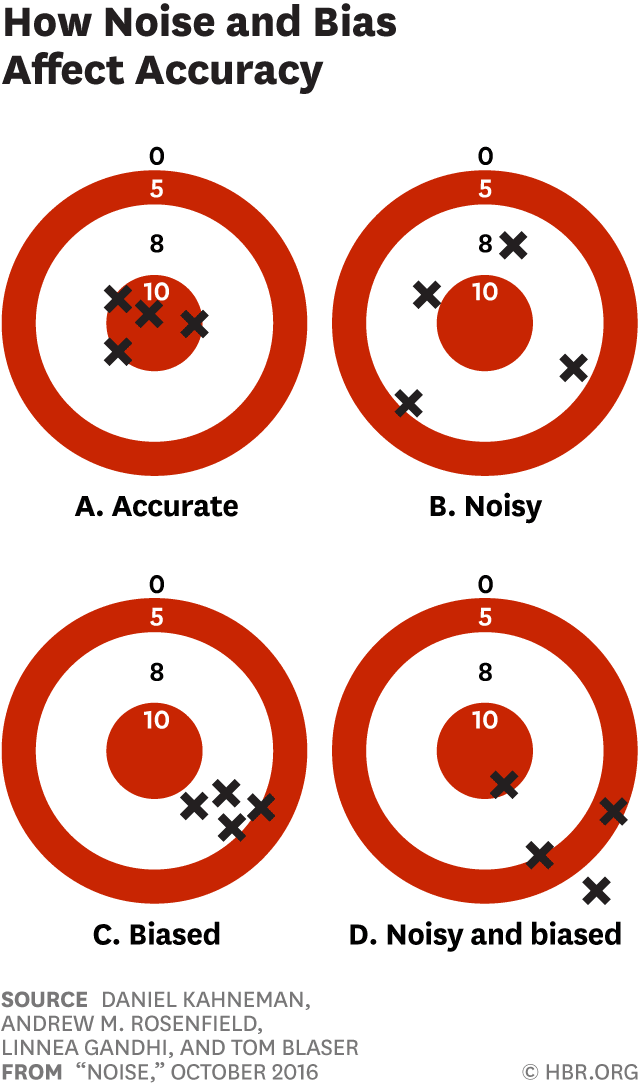
We should distinguish noise from bias. Your bathroom scale is biased if it always reads four kilograms too heavy. If it gives you a different reading each time you get on the scale, it is noisy. Decisions can be noisy, biased, or both. A biased but low noise decision will always be wrong. A biased but high noise decision will be all over the shop but might occasionally get lucky.
This diagram showing the difference between noise and bias looks like the bias-variance diagram you have seen previously. In this case, the concept of bias in the same. But here noise is generated by the individuals inconsistent decision making, whereas variance arose from an overly complex predictive model.
One piece of evidence for noise in decision-making is the degree to which people will contradict their own prior judgements. Pathologists assessing biopsy results had a correlation of 0.63 with their own judgement of severity when shown the same case twice (Einhorn (1974)). Software programmers differed by a median of 71% in the estimates for the same project, with a correlation of 0.7 between their first and second effort (Grimstad and Jørgensen (2007)). The lack of consistency in decision-making only grows once you start looking across people.
14.2 Measuring noise
One useful feature of noise is that you can measure it without knowing the correct or best decision. If you don’t know your weight, it is hard to tell if the scale is biased. But the fact it differs in measurement as you get on, off, and on again points to the noise. If you have a decision for which there is a large lag before you know if it was the right one, this lag is an obstacle to measuring bias, but not for noise.
This ability to measure noise without knowing the right answer avoids the question of whether the human decisions are actually biased. Two inconsistent decisions cannot both be right.
You can measure noise in an organisation’s decision-making processes by examining pairs of decision makers and calculating the relative deviation of their judgements from each other. If one decision maker recommends, say, a price of $200, and the other of $400, the noise is 66%. (They were $200 apart, with the average of the two being $300. 200/300=0.66). You average this noise score across all possible pairs to give you the noise score for that decision.
The noise score has an intuitive meaning. It is the expected relative difference if you picked any two decision makers at random.
Kahneman et al. (2016) measured noise for ten decisions in two financial services organisations. The noise was between 34% to 62% for the six decisions in organisation A, with an average noise of 48%. Noise was between 46% and 70% for the four decisions in organisation B, with an average noise of 60%. This was substantially above the organisations’ expectations. Experience of the decision makers did not appear to reduce noise.