27 Additional information
One possible way to improve decision making might be to simply give people more information.
That information can then be used as an input into a model, or as a source of data for an expert. If that information comprises the cues someone requires to make a decision, or gives them more information about the relationship between the cues and the outcome of interest, it could improve decision quality.
But this is not always the case.
Slovic (1973) reported research on horse race handicappers. They were shown a list of 88 variables relating to horses and their races, and were asked what 5, 10, 20 or 40 variables they would like to be given to help them decide which horses would finish in the first 5 positions in the race.
Then, for a series of races, they would be shown the first five variables, and asked to make a prediction. Then they would be given the next five and a chance to update, the next 10 and a chance to update, and then the final 20 variables and a last chance to update.
With only 5 variables, the handicappers got 17% of the first place finishers right. They did better than chance in making their predictions, as there were 10 horses in each race. How many did they believe they would get right? Across the group they estimated that they would get 19% right. Thus, their confidence was well calibrated to their accuracy.
So what happened when they were provided the next five variables, giving them 10 with which to make their judgement? 17% accuracy and 24% confidence. And with the full 40 variables? 17% accuracy, confidence over 30%. (What is the type of overconfidence being exhibited here?)
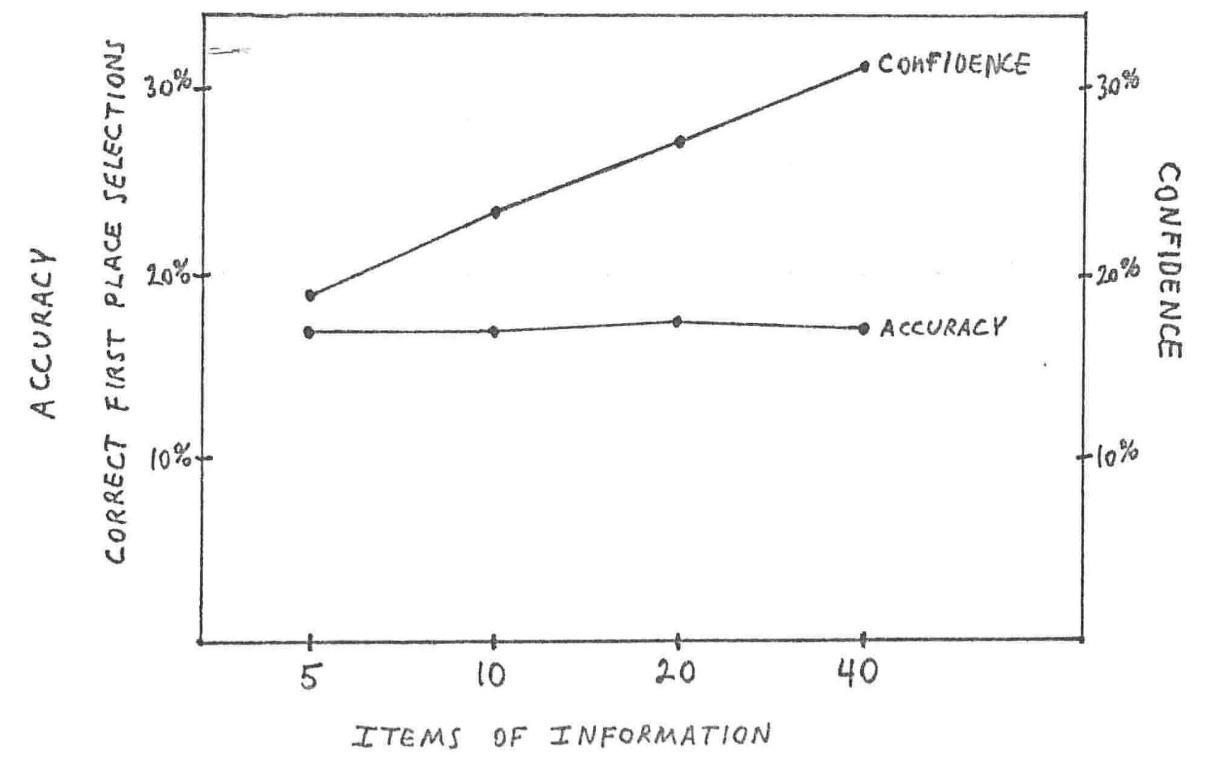
This is a common phenomena. Additional information results in little gain in accuracy, yet substantial increases in confidence. As another example, Oskamp (1965) found that psychologists presented with increasing levels of information to support a clinical diagnosis quickly reached a ceiling in their accuracy, but became increasingly confident with more information.
There are even some cases where the additional information degraded the predictions. Experimental participants predicting NBA outcomes had their accuracy decline when they were given team names in addition to performance statistics (Hall et al. (2007)).
Research on this topic has shown that we are not completely naive. We do have some ability to judge between valid and invalid cues. Accuracy does sometimes increase for certain problems. But the general pattern is that confidence increases faster than accuracy. And this lack of calibration between accuracy and confidence may be more costly than the marginal gain in accuracy that might be achieved with more information.
27.1 Using vividness
Vivid imagery and options with high emotional content tends to have more influence on decision makers than flat statistics. Newell et al. (2007) recount the following example:
Heath et al. (1998) described a technique used by Microsoft that capitalizes on this tendency for vivid information to be weighted more heavily than pallid information. According to Cusumano and Selby (1995; cited in Heath et al. (1998)), software developers at Microsoft were reluctant to believe the statistics obtained by the usability group on the ease of using particular programs and features. The developers often dismiss the statistics as being based on a non-representative sample of `stupid` people who should just `look in the manual` if they didn’t understand something. In an attempt to repair this tenancy to ignore statistical information, Microsoft made the information more vivid by forcing developers to watch customers learning to use the new products. A `usability lab` was set up with a one-way mirror allowing software developers to receive real-time and extremely vivid feedback, but how people actually use new programs. The use of the lab led to much greater empathy between developers and customers. Heath et al. (1998) observed that this is interesting because it uses one kind of bias (the tendency to await vivid information) to counteract another (the tendency to underweight statistical information).